

Operational Boundaries in Carbon Accounting Explained (2026)
Learn what operational boundaries are in carbon accounting, how Scope 1, Scope 2, and Scope 3 emissions are defined, and why they are essential for accurate ESG reporting.
By United Carbon Technologies | Climate Knowledge Hub India
Published: July 2026 | Last Updated: July 2026 | 11 min read
Join readers exploring practical insights on Carbon Accounting, ESG Reporting, Climate Intelligence, Scope 1, Scope 2, Scope 3 Emissions, Sustainability Strategy, and India's transition toward a low-carbon economy.
Once a business has defined organizational boundaries, the next step in greenhouse gas accounting is determining which emissions should be included. This process is known as defining operational boundaries and forms the basis of every corporate carbon inventory.
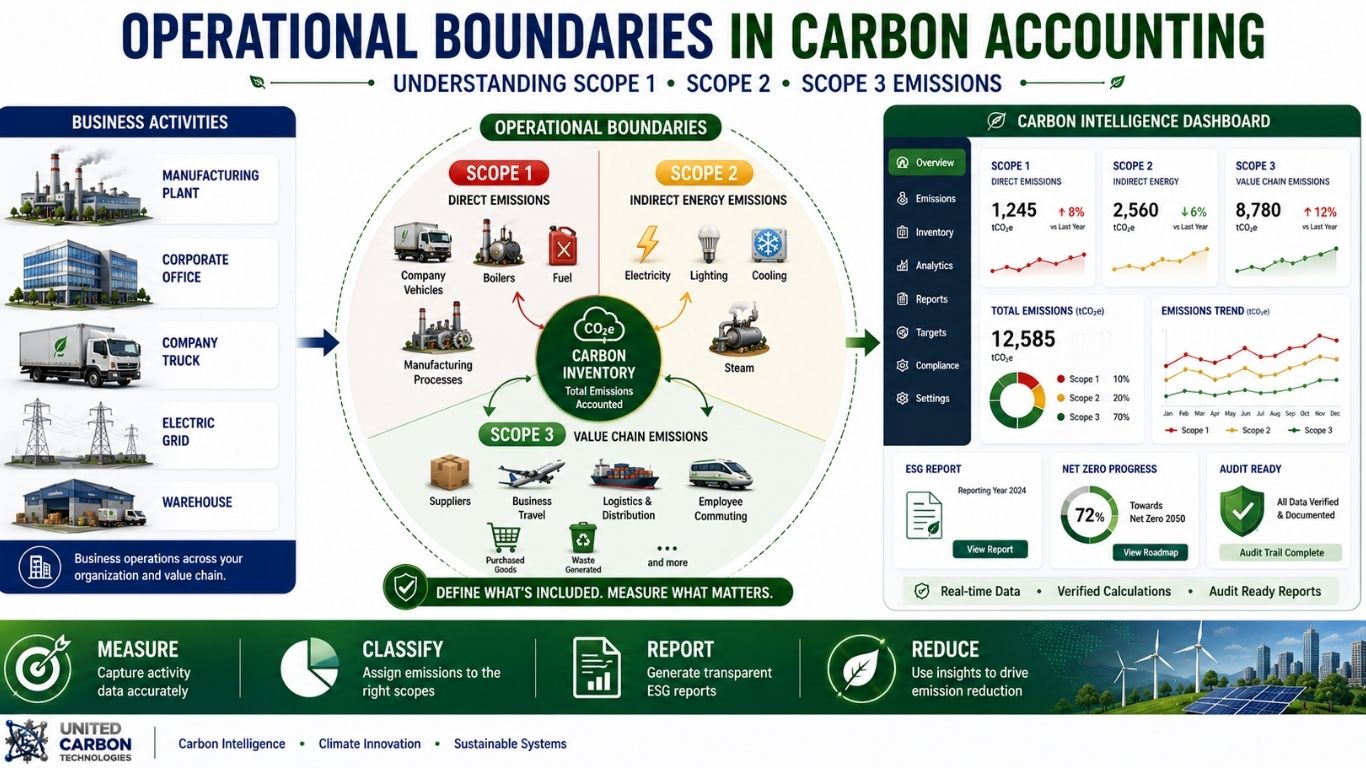
Operational boundaries classify greenhouse gas emissions into Scope 1, Scope 2, and Scope 3, ensuring that businesses report emissions consistently and transparently. Without clearly defined operational boundaries, carbon inventories can become incomplete, inconsistent, or difficult to compare across reporting periods.
This beginner-friendly guide explains what operational boundaries are, how they relate to the GHG Protocol, how Scope 1, Scope 2, and Scope 3 emissions are identified, and why they are critical for accurate carbon accounting, ESG reporting, and Net Zero planning.
Featured Snippet
Operational boundaries define which greenhouse gas emissions a business reports after establishing its organizational boundaries. Using the GHG Protocol, emissions are categorized into Scope 1 (direct), Scope 2 (indirect energy), and Scope 3 (other indirect emissions) to create a complete and consistent carbon inventory.
Introduction
Defining operational boundaries is one of the most important steps in building a reliable greenhouse gas inventory. After determining which parts of the business are included through organizational boundaries, companies must identify the emissions generated by those operations.
The GHG Protocol organizes greenhouse gas emissions into three internationally recognized categories: Scope 1, Scope 2, and Scope 3. This framework allows organizations to measure emissions consistently, identify major emission sources, and develop targeted reduction strategies.
Whether a company operates a single office or multiple manufacturing facilities across different regions, clearly defined operational boundaries improve reporting accuracy, support regulatory compliance, and strengthen sustainability reporting.
Understanding operational boundaries is essential for businesses beginning their carbon accounting journey and for organizations preparing ESG reports, climate disclosures, or Net Zero roadmaps.
Carbon Intelligence • Better Boundaries • Better Climate Decisions
Helping Organizations Build Reliable Carbon Inventories
United Carbon Technologies is developing digital Carbon Intelligence solutions that help businesses classify emissions, automate greenhouse gas calculations, improve ESG reporting, and transform sustainability data into actionable business intelligence.
💡 Did You Know?
- The GHG Protocol introduced Scope 1, Scope 2, and Scope 3 to create a globally consistent framework for greenhouse gas reporting.
- For many businesses, Scope 3 emissions account for more than 70% of their total carbon footprint.
- Clear operational boundaries help organizations avoid missing major emission sources during ESG reporting.
- Accurate operational boundaries support better climate strategies, risk management, and Net Zero planning.
1. What Are Operational Boundaries?
Operational boundaries define which greenhouse gas emissions are included in a company's carbon inventory after organizational boundaries have been established. They classify emissions according to the source of the emissions rather than the ownership of the business entity.
Using the GHG Protocol, businesses categorize emissions into Scope 1, Scope 2, and Scope 3. This standardized classification ensures that emissions are measured consistently across organizations, industries, and reporting years.
Operational boundaries provide a structured approach for identifying emission sources throughout business operations, allowing organizations to understand where emissions occur and where reduction opportunities exist.
Examples of Emission Sources
- Company-owned vehicles
- Manufacturing equipment
- Purchased electricity
- Business travel
- Employee commuting
- Purchased goods and services
- Waste disposal
- Logistics and transportation
2. Why Operational Boundaries Matter
Operational boundaries ensure that greenhouse gas emissions are reported using a consistent methodology. They help businesses identify direct and indirect emissions, improve data quality, and provide stakeholders with a transparent view of environmental performance.
Without operational boundaries, organizations may overlook significant emission sources, double count emissions, or produce inconsistent carbon inventories that reduce the credibility of ESG reporting.
Benefits of Defining Operational Boundaries
- Improves carbon inventory accuracy.
- Supports transparent ESG reporting.
- Identifies major emission hotspots.
- Aligns with the GHG Protocol.
- Supports Net Zero target setting.
- Improves climate-related decision-making.
Correctly identifying Scope 1, Scope 2, and Scope 3 emissions is essential for reliable carbon accounting and meaningful sustainability reporting.
United Carbon Technologies is developing Carbon Intelligence solutions that help businesses define operational boundaries, automate Scope 1, Scope 2, and Scope 3 calculations, and simplify ESG reporting through intelligent digital platforms.
3. Understanding Scope 1 Emissions
Scope 1 emissions are direct greenhouse gas emissions generated from sources that are owned or controlled by the organization. These emissions are produced as part of the company's own operations and are generally the easiest to identify because they originate within the organization's operational boundaries.
Businesses can often reduce Scope 1 emissions through fuel efficiency improvements, equipment upgrades, process optimization, electrification, and the adoption of cleaner energy sources.
Common Scope 1 Sources
- Company-owned vehicles
- Diesel generators
- Industrial boilers and furnaces
- Manufacturing processes
- Refrigerant leakage from cooling systems
- On-site fuel combustion
4. Understanding Scope 2 Emissions
Scope 2 emissions are indirect greenhouse gas emissions associated with the generation of purchased electricity, steam, heating, or cooling consumed by an organization. Although these emissions occur outside the company's facilities, they result directly from the energy the organization purchases.
For many office-based businesses, Scope 2 represents one of the largest measurable emission sources and is often the first area where renewable energy initiatives can significantly reduce the carbon footprint.
Examples of Scope 2 Sources
- Purchased electricity
- Purchased steam
- District heating systems
- Purchased cooling services
5. Understanding Scope 3 Emissions
Scope 3 emissions include all other indirect emissions that occur throughout an organization's value chain. These emissions are not produced directly by the company or by its purchased electricity but arise from activities connected to suppliers, customers, transportation, waste, investments, and product use.
For many organizations, Scope 3 is the largest and most complex category because it spans activities beyond the company's direct operational control.
Common Scope 3 Categories
- Purchased goods and services
- Business travel
- Employee commuting
- Transportation and distribution
- Waste generated in operations
- Capital goods
- Use of sold products
- End-of-life treatment of products
6. How Businesses Define Operational Boundaries
After establishing organizational boundaries, businesses identify every significant emission source and classify it into Scope 1, Scope 2, or Scope 3. This process creates a complete greenhouse gas inventory and provides the foundation for climate reporting.
Typical Process
- Identify business activities.
- List all emission sources.
- Determine ownership and operational responsibility.
- Assign emissions to Scope 1, Scope 2, or Scope 3.
- Collect activity data.
- Apply appropriate emission factors.
- Review and verify calculations.
Following a structured methodology improves reporting consistency and simplifies future carbon accounting exercises.
7. Common Challenges and Mistakes
Defining operational boundaries may seem straightforward, but organizations frequently encounter challenges when identifying indirect emissions and determining the correct scope classification.
Common Mistakes
- Missing important Scope 3 categories.
- Double counting emissions.
- Incorrectly classifying purchased electricity.
- Using inconsistent reporting methods each year.
- Ignoring outsourced activities.
- Not documenting calculation assumptions.
- Failing to review operational changes annually.
8. Best Practices for Setting Operational Boundaries
- Follow the GHG Protocol consistently.
- Document every emission source.
- Review reporting boundaries annually.
- Use current emission factors.
- Engage suppliers to improve Scope 3 data.
- Maintain complete calculation records.
- Use digital Carbon Intelligence platforms to automate reporting.
9. Operational Boundaries in the Indian Business Context
Indian businesses are increasingly measuring greenhouse gas emissions to meet customer expectations, supply chain requirements, investor demands, and evolving sustainability regulations. Manufacturing, logistics, pharmaceuticals, information technology, construction, and export-oriented industries all benefit from clearly defined operational boundaries that improve reporting quality and support international ESG frameworks.
As more Indian companies adopt climate reporting, consistent Scope 1, Scope 2, and Scope 3 classification will become an important competitive advantage.
10. Building Better Carbon Inventories with Clear Operational Boundaries
Operational boundaries are more than a reporting requirement—they are a strategic management tool. By accurately classifying emissions into Scope 1, Scope 2, and Scope 3, businesses gain deeper insight into where emissions occur and where reduction efforts can deliver the greatest impact.
Organizations with clearly defined operational boundaries are better prepared for ESG reporting, climate disclosures, Net Zero planning, and future regulatory requirements.
Transform Emissions Data into Climate Intelligence
United Carbon Technologies is developing Carbon Intelligence solutions that help organizations classify emissions, automate Scope 1, Scope 2, and Scope 3 calculations, strengthen ESG reporting, and build reliable carbon inventories for long-term sustainability success.
India Context
With growing participation in global supply chains and increasing focus on sustainability disclosures, Indian businesses are expected to demonstrate transparent greenhouse gas reporting. Clearly defining operational boundaries helps organizations produce reliable carbon inventories that align with international frameworks and support responsible business practices.
What's Next?
Now that you understand both organizational boundaries and operational boundaries, the next step is learning how businesses collect and manage primary and secondary carbon data to improve calculation accuracy and reporting quality.
Related Reads
- How Businesses Define Organizational Boundaries for Carbon Accounting
- What Are Emission Factors? A Beginner-Friendly Business Guide
- Spend-Based vs Activity-Based Carbon Accounting Explained
- How to Collect Supplier Carbon Data
- Understanding Scope 3 Emissions
- Carbon Accounting Explained
💡 Expert Insight
Many organizations initially focus on direct emissions because they are easier to measure. However, a comprehensive greenhouse gas inventory requires equal attention to indirect emissions, particularly Scope 3, which often represents the largest share of a company's carbon footprint. Building robust operational boundaries today creates a stronger foundation for long-term climate strategy and ESG reporting.
Conclusion
Operational boundaries provide the structure needed to transform business activities into a complete greenhouse gas inventory. By correctly identifying Scope 1, Scope 2, and Scope 3 emissions, organizations can improve reporting accuracy, identify reduction opportunities, and build credible sustainability strategies.
Combined with well-defined organizational boundaries, operational boundaries form the backbone of effective carbon accounting and help businesses prepare for a future where climate transparency is increasingly expected by customers, investors, and regulators.
Quick Summary
- Operational boundaries classify emissions into Scope 1, Scope 2, and Scope 3.
- They are established after organizational boundaries.
- Scope 1 includes direct emissions.
- Scope 2 covers purchased energy emissions.
- Scope 3 includes value chain emissions.
- Clear operational boundaries improve ESG reporting and carbon accounting.
- Consistent classification supports better climate decision-making.
Frequently Asked Questions (FAQs)
1. What are operational boundaries?
Operational boundaries define which greenhouse gas emissions are included in a company's carbon inventory by classifying them into Scope 1, Scope 2, and Scope 3.
2. How are operational boundaries different from organizational boundaries?
Organizational boundaries determine which entities are included in reporting, while operational boundaries determine which emissions from those entities are reported.
3. What is included in Scope 1?
Direct emissions from owned or controlled sources such as company vehicles, generators, and industrial equipment.
4. What is included in Scope 2?
Indirect emissions from purchased electricity, steam, heating, or cooling.
5. Why is Scope 3 important?
Scope 3 often represents the largest share of a company's total emissions because it includes value chain activities.
6. Do all businesses need to report Scope 3?
Requirements vary by reporting framework and stakeholder expectations, but measuring Scope 3 is increasingly encouraged.
7. How often should operational boundaries be reviewed?
Organizations should review them annually or whenever significant operational changes occur.
8. Can digital ESG software automate emissions classification?
Yes. Many Carbon Intelligence platforms automate emissions classification, calculations, and reporting workflows.
9. Why are operational boundaries important for Net Zero?
They provide the data needed to identify emission hotspots, prioritize reductions, and track progress toward climate goals.
10. Which framework defines operational boundaries?
The GHG Protocol Corporate Standard provides the internationally recognized framework for defining operational boundaries.
Key Takeaways
- Operational boundaries define which emissions are reported.
- Scope 1, Scope 2, and Scope 3 form the basis of greenhouse gas accounting.
- Accurate classification improves ESG reporting quality.
- Regular reviews maintain reporting consistency.
- Digital Carbon Intelligence tools simplify emissions management.
Build Better Carbon Accounting with United Carbon Technologies
Understanding operational boundaries is a key milestone in your carbon accounting journey. Explore more expert guides from United Carbon Technologies to strengthen your ESG reporting, improve emissions management, and build a data-driven sustainability strategy.